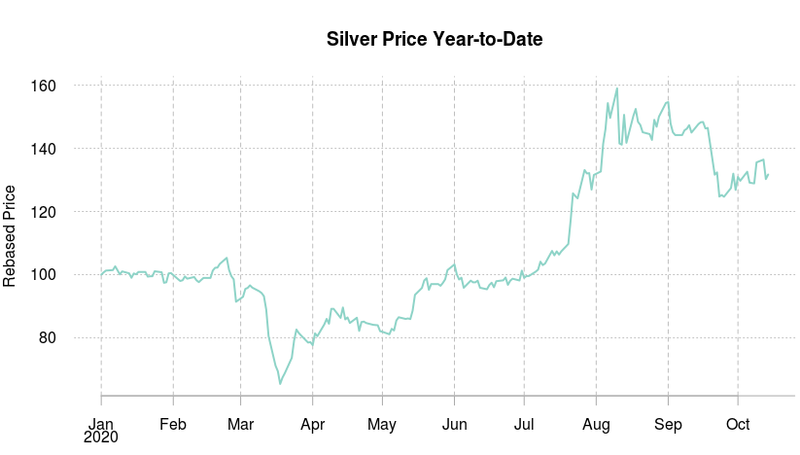
The expected Democratic success for the US election (the “Blue Wave”) by a wide margin has made the market price a Biden led government policy. The biggest factor overall is fiscal stimulus which is likely to be above $2 trillion but the allocation may differ from industry to industry (which is likely to occur after the elections). The market still reflects an oversized central bank and fiscal stimulus package with an economy which is by and large adapting well to the new normal. The prospect of an early vaccine approval could even make things better following the election of a new president. The real risk is the timing of the pricing of macro policy shifts from a Democratic sweep, in particular the rise in corporate taxes (corporate tax from 21 to 28% and GILTI tax from 11% to 21%). Communications, healthcare and information technology sectors, which have been the drivers of the equity market performance are the most exposed to such taxes. With no apparent risks to the economy and with the central bank becoming more hawkish, gold (-4.2% on the month) experienced strong outflows of money managers (although ETFs flows remained positive). Industrial metals were generally lower on the month but talks around the greenification plan by the Democrats should increase demand for metals over the next few years.
The petroleum complex remains range bound while demand is improving. The market remains balanced with slow inventory reduction from the backlog created in April and May. Implied demand in the US has returned close to normal levels while global demand weakness has been balanced by the OPEC cuts. Biden election may be bullish in the short term as additional regulatory constraints will increase the marginal cost of production of shale (both oil and gas). Should Iran be able to resume exporting oil, it could change the global supply equation. Gas seemed to be favored by a Biden administration and even with a higher cost of production we may also see higher demand. Such potential policy outcomes are likely to be priced in at the back end of the curve. Long dated contracts were up 1.5% compared to short dated ones over the month. Natural gas back end contracts were flat on the month versus 6% down with front end contracts.
China stepped up its imports of corn and soybean, helping to meet the phase-one trade deal quota. Demand easily met with supply as USDA data showed as of 28th September 20% of soybean (up 7% in sept) and 15% of corn (up about 6%) crops had already been collected.
The market expects even more volatility during coming US elections: whereas the longer term implied volatility is roughly flat at 30% for the S&P 500, the terms structure shows a spike around the election time at 35%. We have seen a pretty similar story in Europe albeit less pronounced. The VSTOXX is unchanged, from 26.72% to 26.05% on the month but the realized volatility on Eurostoxx 50 is up from 18% to 24%, and the forward volatility curve also shows a bump in November. In precious metals, the implied volatility mean reverted down, a sign of easing of the nervousness brought by overbought underlyings, as underlying prices deflated a bit.
Source: Four Elements Capital


