Global Macro/Metals:
The 21% rise in the S&P 500 during the second quarter of 2020, the best quarter since 1998, showed the extent of the impact of the monetary and fiscal policy support. The info-tech sector benefited most from the recovery, industrial commodities were up due to expected increase of consumption as activity increased back. Copper experienced supply disruptions in Chile (28% of the world production) due to Covid and increased by 11%, other base metals moved only slightly higher. The situation in China remains poor and the level of activity remains much lower than before the crisis1. Investors’ interest for gold has also increased with ETFs’ investment up 20% YoY. Lower real interest rate levels and the monetary impact of the Fed’s new lending facilities is continuing to fuel concerns on the ongoing debasement and the duration of the ultra-loose monetary policies (it lasted nearly 4 years post 2008). Given the ‘de-globalisation’ of the economy in general, it is also unclear whether the current crisis could lead to a second round of shocks such as social unrest, political volatility or rising international tensions. Gold in Euro terms was up 2% over the month and 18% YTD.
Energy:
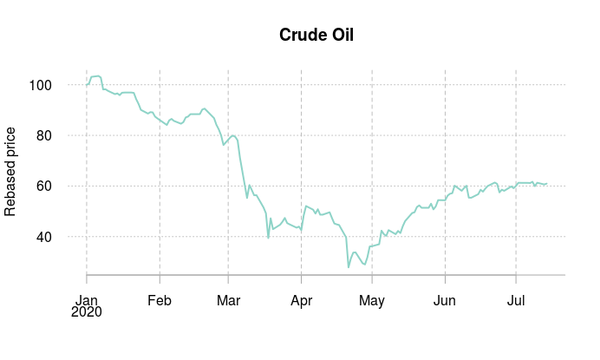
Fundamentals in the petroleum sector show a new equilibrium. We remain in a very high inventory situation but the latest short term fundamental data suggests that production cuts in general are sufficient to balance out the demand. Weekly inventory numbers have been in line with the seasonal average over the last 3 weeks for crude and heating oil, but are decreasing strongly for gasoline. Few benefited from the rally in oil over the last few months, even with about 100 Mio USD inflows in the largest oil ETF (USO), this investment has generated -20% return, despite a strong rally in spot prices, due to negative carry embedded in the rolling of the contracts. The curve has now flattened and given the inventory overhang and the budgetary stress that Covid is creating in oil-producing countries, the risk is again on the downside.
Agriculture:
Oil spot price rebound has increased demand for biofuels (corn +3.5% and sugar +8%), but corn and sugar are set for historically large levels of production this year and Covid related disruption has dampened their overall demand outlook. Soybean volatility over the month was triggered by fresh sales from the US to China (China purchased nearly 5 mio metric tons of American soybeans according to USDA). Soybean was up 3.5 % on the month.
Volatility:
Volatility levels remain that of a nervous market across assets classes (about twice the levels of a relaxed market). In the equity sector, the implied volatility is back down to the 30 level after a spike to the low 40’s on 11th June which saw the worst day since March in US equities amid concerns of a market recovery that was too fast and not in line with the real economy, and especially the poor prospects of unemployment dropping fast. In the energy sector, Crude implied volatility (down from 67% to 45% on the month) seems to continue its way toward its “normal” level of 30%. In the agricultural sector, volatility seems to be picking up again in tandem with rising underlying prices. Corn implied volatility was up from 24% to 29% on the month whereas for Soybean it was up from 15% to 16%.
1 Read the latest reports to our proprietary indices on China’s monetary conditions: Commodity Leading Index Monetary China and Commodity Leading Index Economic Activity China
Source: Four Elements Capital


