Global Macro/Metals:
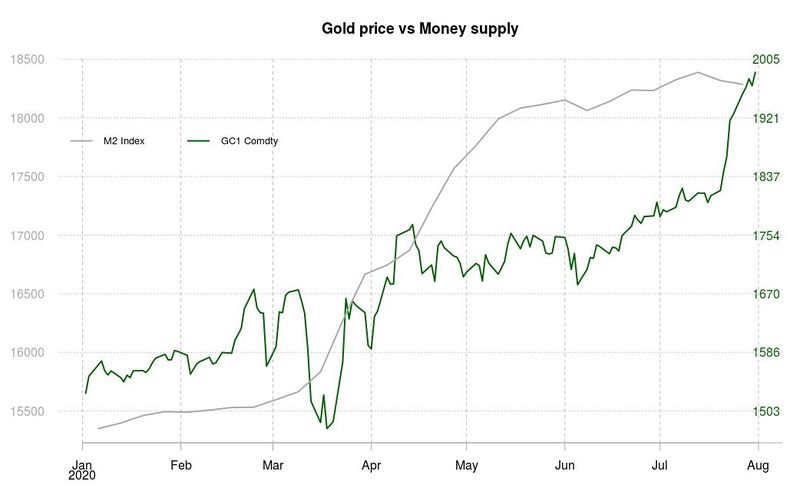
Milton Friedman warned us that “Nothing is so permanent as a temporary government program”. Central banks’ roles and policies changed after 2008 and dovish policies have been the norm since then, a sustained deflationary environment has not proven central bankers wrong. Since February 2020, the Fed has bought or committed to buy more than it did in 3 years after 2008. Its balance almost doubled in 3 months (from 4.2 Trillion USD to a peak of 7.2 Trillion USD, it was less than 1 Trillion in July 2008). This amount corresponds to the total amount of reserves of China and Hong Kong combined, that’s the competitive advantage of having a free floating global reserve currency. Consumer basket of goods may not be inflationary but hard assets will become more expensive through currency depreciation. Precious metals and gold in particular have been the main beneficiaries of such a situation and that is, if Milton Friedman was right, likely to continue for the foreseeable future. The long term risk of a ‘trust’ in the US dollar as a reserve currency makes the tail risk of a gold surge even higher. ETFs investments have still remained modest, particularly given the size of the debt being issued.
Energy:
The supply and demand balance in July for the petroleum complex shows a deficit which is expected to remain (at current price) of about 2.5 Mio b/d; at this pace the market should take 3-4 months to return to a more normalized inventory level. The price action has remained thus in a tight range, bounded by capacity availability if price were to rebound and the current OPEC+ agreement to cut production (which has been effective in balancing the market and was helped by China which has purchased and maxed-out its storage capacity over the last few months). US production has increased sharply in July and shale activity is keeping the industry afloat with a lower cost of financing and the ability to hedge the back end of the curve at a price close to 45 USD / barrel. The shape of the curve remains in contango, pricing in the risk of Covid resurgence or a breach in the OPEC+ agreement which would move the spot price lower, as inventory normalizing the curve would be expected to move more in backwardation.
Agriculture:
For corn, July was a month of two halves, with the first part bullish based on the lower acreage report from USDA but the second part bearish as weather conditions improved US crop significantly (down 7% on the month, 22% on the year). Wheat was up in July as Chinese buyers imported a significant amount of stock and the nation supposedly sought to increase food supply amid Covid pandemic and take advantage of cheap prices despite tensions.
Volatility:
July saw a sharp reduction in equity volatility, more pronounced for realised volatility than implied volatility, and especially for US large caps, driven by a sharp rally in large tech stocks. The VIX is down on the month from 30.43% to 24.46% but stands now at a significant 10.58% premium to realised volatility, now down to just 13.87%, pretty much that of a non-volatile market. In contrast, the RVX, the Russell 2000 (small caps) volatility index ends the month at 33.10% with realised volatility for small caps at 24.47%. In Europe the VSTOXX is down from 31.71% to 26.66% with realised volatility of 20.54%. In contrast to equity, the sharp gains in precious metals have translated into an increase in implied volatility. Implied volatility for gold is up from 17% to 21% while for silver it is up from 34% to 44%. The implied volatility of crude continues its course towards a “normal” level of 30%, down from 45% to 35% on the month, with an underlying price gravitating closely around US40/bbl. The implied volatility in the agricultural sector is also on course to reach pre-Covid levels. Implied volatility for corn is down from 29% to 18% while for soybean it is down from 16% to 12%.
Source: Four Elements Capital


