Global Macro/Metals: Crude oil was the most impacted financial asset by the Coronavirus (COVID-19) epidemic and its new low price will have a widespread impact on the wider economy. Lower energy prices will be deflationary for commodity production costs and will potentially help central banks in their easing process in response to the situation. In China, strong policy support has failed to accelerate the velocity of money in the country. The restricted room for manoeuver of the ECB this week means that the market only expects limited action on the existing policy stance. Following its recent 50 bp cut, the Fed has 100 bp left before reaching the crisis-era lower bound of 0-25 bp. Given the sound financial system and the lack of systemic risk, the fiscal policy response is likely to be limited and will take time. Corporate lending is the most vulnerable in this situation where earnings delay and high leverage will trigger stress situations very quickly. Precious metals did not benefit as much as expected yet from the situation (gold was down 1% in February but was up early in March by nearly 7%). Their safe haven status, lower rates and continued lack of inflation should be even more supportive. Industrial metals demand has rebounded in China at the end of the month but the industrial disruption remains the largest one seen in the country since 2008. Surprisingly, the price action on industrial metals has remained subdued mainly due to the fact that smelters and refiners in China have been encouraged to continue their production, resulting in a strong inventory build up (our base metal basket was flat on the month).
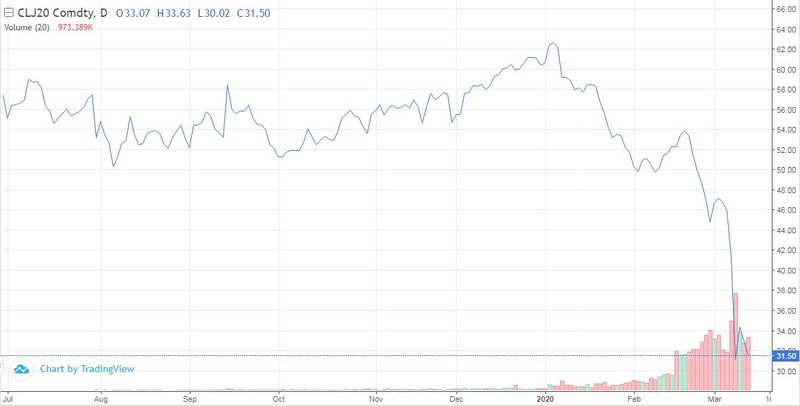
Energy: On the petroleum complex, the demand shock due to the reduction of global travel and transportation, has been the trigger to break the fragile OPEC and Russia price support that has been in place. They, in combination, reduced production by 4.4 mb/d since November 2016 as the rest of the world increased output by 5.7 mb/d. Saudi Arabia, the producer with the biggest spare capacity at 1.8 mb/d, cut the relative price at which it sells it crude by the most in more than 20 years and plan to increase production up to 12 Mio mb/d. Russia is also following with additional output, both with the intention to put high-cost producers out of business and gain market share. The possibility of an OPEC agreement seems low at the moment and the production cuts are likely going to come from the shutting down of high cost wells (shale, offshore, etc). Inventory should build up as elasticity of production depends on the amount of hedging already done by producers. Shale producers in particular usually hedge their production in advance and are expected to start reducing in Q3 2020 (Crude oil was down 12% in February, 23% YTD, by 9th March was down 44% YTD). On natural gas, a warm winter has also pushed prices very low in the US. The Atlantic arbitrage was not much in favor of liquefaction, resulting in a glut for the Henry Hub contract.
Agriculture: Grains sector has been relatively stable during the month and not affected by the overall crisis. Overall, the agriculture sector should have reduced costs due to lower energy prices. Rubber (-8%) was affected due to its linkage to transportation (tyres).
Volatility: Volatility continued to rise in February due to concerns over the spread of the Coronavirus. The highest volatility levels remain in the energy sector, with crude oil implied volatility for ATM calls up from 42% to 53% on the month. The equity sector saw a sharp spike in volatility at the end of the month with VIX up from 18.84% to 40.11% and VSTOXX up from 17.15% to 42.23%. Gold realised volatility went up significantly throughout the month, accompanied by a sharp increase of its implied volatility from 12% to 20%. Just as in January, however, silver was more stable with implied volatility only up from 18% to 19%. Corn implied volatility reverted back to pre-January levels, up from 15% to 17% on the month, with a spike at the end of month in sync with the equity sector. Soybean implied volatility was unchanged at 14% with barely any move in the underlying.
Source: Four Elements Capital

