Contents
- 1 Indices and Sub Indices
- 2 Relationship with popular assets
- 3 Strategies using AMCI
- 4 How to implement this strategy on Alphien
Indices and Sub Indices
Alphien Monetary Conditions Index products are composite indices representing current market and monetary conditions.
They are based on a number of sub-indices and financial variables, each translating specific underlying trends in market risk aversion, interest rates, credit risk, market expectations and money flows.
Every AMCI index is computed and published daily.
A reading above zero indicates loosening and below zero tightening of financial conditions relative to the mean.
Upwards movements of the index indicate improving and downward movements deteriorating financial conditions.
Relationship with popular assets
As they were designed to reflect underlying economic and monetary conditions, AMCI indices have useful relationships with many tradable assets.
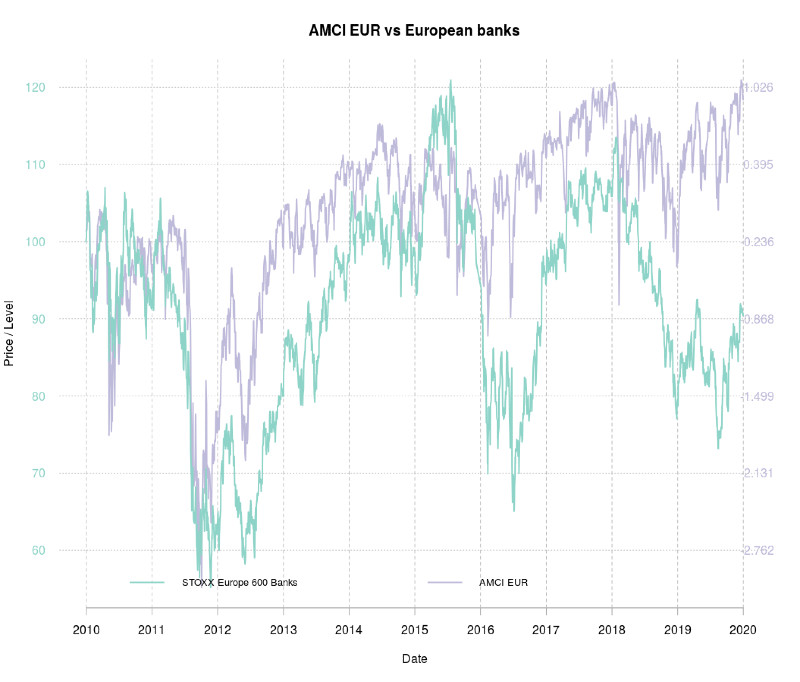
Let’s import some data and compare AMCI EUR to STOXX 600 Europe Banks using the Alphien platform:
alphatonAssets = getAlphathonBBs(asPrice=TRUE) #get time series for April 2020 Alphaton > amci = getAlphathonData(ticker=c(‘AMCIsUSD’, ‘AMCIsEUR’, ‘AMCIsGL’), asPrice = T) #get AMCI time series > data = na.omit(cbind(alphatonAssets, amci)) > colnames(data) = c(‘usTreasury’, ‘usHighYield’, ‘euBanks’, ‘AMCIsUSD’, ‘AMCIsEUR’, ‘AMCIsGL’)
tail(data) usTreasury usHighYield euBanks AMCIsUSD AMCIsEUR AMCIsGL 2019-12-23 136.0517 193.5864 90.79742 0.5327598 1.0718240 0.9804802 2019-12-24 136.2840 193.6671 91.37326 0.5293407 1.0648928 0.9750819 2019-12-26 136.3504 193.6671 91.37326 0.5328055 1.0630584 0.9790492 2019-12-27 136.6491 193.9898 90.87354 0.5002751 1.0401210 0.9441217 2019-12-30 136.5163 193.9180 90.73550 0.4372933 0.9272732 0.8675662 2019-12-31 136.4002 193.8104 90.42618 0.4645947 0.9264342 0.8664413
#plot AMCI EUR against STOXX 600 Europe Banks > plotAl(list(data$euBanks, data$AMCIsEUR), title=‘AMCI EUR vs European banks’, rebase2=TRUE, ylab=‘Price / Level’, xlab=‘Date’, legend.labs=c(‘STOXX Europe 600 Banks’, ‘AMCI EUR’) )
Figure 1: AMCI EUR vs STOXX 600 Banks price
Strategies using AMCI
Implementation
Alphien users can integrate AMCI indices as leading indicators for their investment strategies.
On the previous chart, the AMCI EUR Index seems to be leading movements in the STOXX Europe 600 Banks Index.
We can use the Alphien platform to build a strategy around that:
We go long the STOXX Europe 600 Banks when the AMCI EUR has positive momentum, as defined by a moving average crossover strategy.
We calculate our short and long moving averages over 1 and 6 months periods.
This strategy can be implemented in a few lines on the Alphien platform:
strategy = algoEngine(‘BNKa’, type=‘MM’) %>% payout(smaCross, px=data$AMCIsEUR, long=20, short=130, longOnly=TRUE) %>% evaluate()
As smaCross is included in Alphien Quantitative Library (Qlib), we did not have to write our own payout function.
We can inspect the smaCross code in Qlib to check the exact behaviour of this strategy:
px price series of close price or building block # short short-term SMA periods (in days) # long long-term SMA periods (in days) # longOnly boolean. If set to TRUE, short signal is 0, else -1 # return Xts of allocation smaCross = function(px,short=60,long=240, longOnly=F){ shortSignalType = ifelse(longOnly, 0, -1) ind = na.omit(ifelse(SMA(px,n=short) - SMA(px,n=long)>0,1,shortSignalType)) return(ind) }
Alphien users can use and combine any of the many strategies included in Qlib or create their own payout functions.
Using custom payout functions, there is no limit to how complex strategies can be.
Visualising allocation
Let us now use some of the platform’s analysis tools to see how our strategy would have performed over the backtest period.
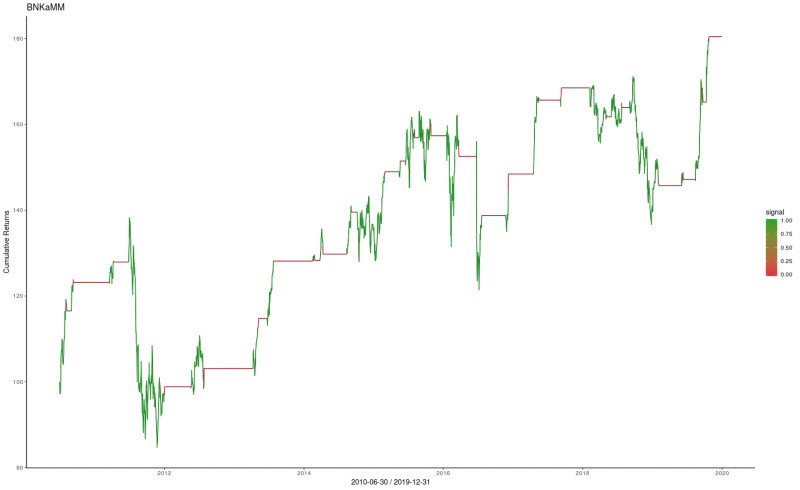
Analyse() generates a chart of our strategy signal and how it would have performed over the period.
The signal generated by our strategy is fairly simple with allocation to our asset of either 100% (signal 1) or 0% (signal 0).
When building more complex strategies with dynamic weight adjustments and short positions, analyse() is a useful tool to visualise allocation.
analyse(strategy)
Figure 2: visualisation of emaCross strategy signal
Backtest
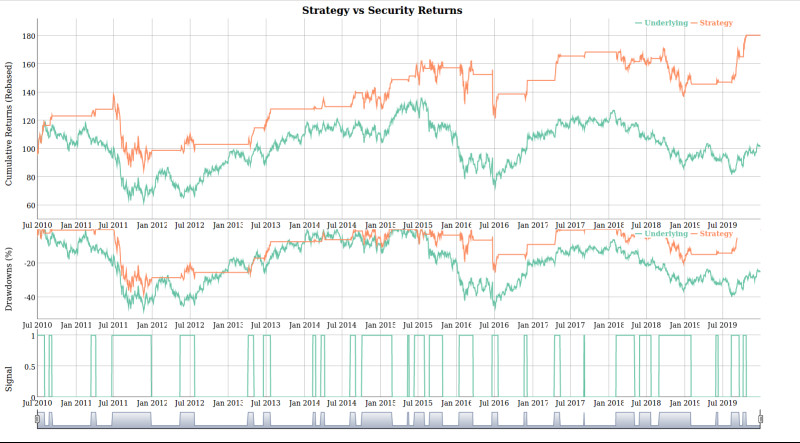
We can now use backtest() to visualise our strategy performance compared to the underlying asset.
The function will also return a number of useful performance and risk metrics.
backtest(strategy)
Figure 3: Performance, drawdown and signal for emaCross strategy
Figure 4: backtest results
| Performance Metric | Value | Interpretation |
|---|---|---|
| Annualized Return (%) | 6.40 | Strategy return over the period re-scaled geometrically to a period of one year |
| Cumulative Return (%) | 80.45 | Total strategy performance over the backtest period |
| Annualized Volatility (%) | 17.96 | Annualized volatility of the strategy |
| Kurtosis | 23.16 | A measure of tailedness. A positive Kurtosis implies that returns have thinner tails compared to a Normal Distribution |
| Skewness | -0.94 | A measure of returns distributions symmetry. In the particular case, the skew is negative implying that more than 50% of return values are greater than the returns mean |
| Success Ratio (%) | 52.93 | Percentage of returns that are positive |
| Best Trade (%) | 8.53 | Highest daily return over the period |
| Avg Success (%) | 1.34 | Average value of positive returns |
| Worst Trade (%) | -15.11 | Lowest daily return over the period |
| Avg Failure (%) | -1.32 | Average value of negative returns |
| Sharpe Ratio | 0.35 | Metric of risk adjusted performance |
| Sortino Ratio | 0.50 | A variation of Sharpe ratio using downside deviation instead of standard deviaion |
| Calmar Ratio | 0.16 | A risk adjusted performance metric focused on extreme risks (using maximum drawdown) |
| Sterling Ratio | 0.13 | A variation of the Calmar Ratio where maximum drawdown is increase by 10% |
| Maximum Drawdown (%) | -38.73 | Maximum difference between “peak” and “valley” over the backtest period |
How to implement this strategy on Alphien
Global and Regional AMCI indices are available on the Alphien platform.
Please check the AMCI Indices notebook for a step by step demonstration on how to access AMCI data and implement this strategy.


