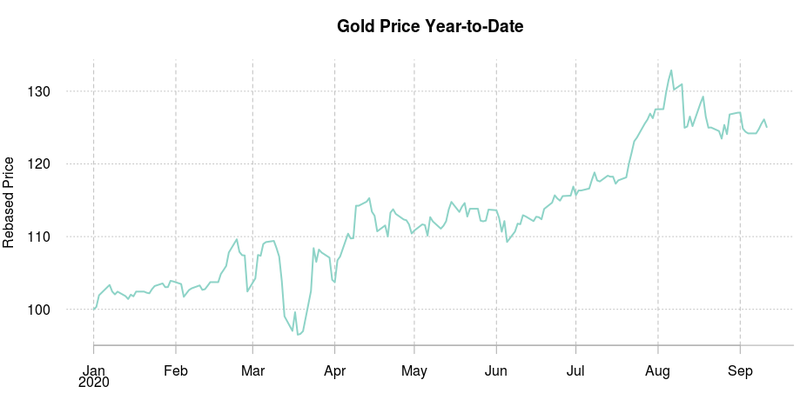
The increased likelihood of the dissemination of an FDA-approved coronavirus vaccine before the end of the year, along with strong manufacturing and construction numbers, continues to fuel optimism for the Equity market. The virtualisation of a lot of businesses from online purchase to online meetings, has led to a sharp recovery. Consumer behaviors are also adapting, albeit still suffering from social distancing measures. The economic risks are from emerging markets and the end of the fiscal packages that has been the norm for the last few months. The V shape rebound of the economies and particularly the recovery in China has helped a strong rebound of industrial commodities (base metal was up 5% on average in August). Silver was a strong outlier and caught up with the year to date performance of gold (silver was up 17% in August, gold was flat in USD terms with increased volatility).
Petroleum inventory has continued to normalize with OPEC+ reduced production and increasing demand. With price climbing up we can continue to expect higher OPEC+ quotas and restarting of production in North America (which appears to be very price elastic). The situation is reflected in the curve where short term prices remain lower than long term prices with expectation of back to backwardation by 2021. Distillate consumption has remained high particularly compared to gasoline (up 9% vs heating oil flat for the month). Particularly hot weather in the US helped push gas prices to new high, storage injection was also slowed due to summer heat, rising exports and reviving industrial consumption from pandemic related reopening.
Weather also influenced the harvest for grains from a low price level. Corn yield was reaching a new record for 2020 with 181.8 bushels per acre but USDA stock piles came below expectation.A storm blew into Iowa, flattening the crop, creating difficulty for harvesting and hurted the yield. Increased demand from China also helped the price to rise (+9% in August). Soybean also rallied strongly in August after a drop due to escalating tensions at the end of July but the phase-one deal (very bullish soybean) was back on track in August (China has bought 20% of the US agricultural product it has pledged to buy in 2020).
In the volatility sector, August saw the development of a substantial volatility risk premium on the SP 500. While the VIX was up from 24.46% to 26.41% on the month, the realized volatility on SP 500 has collapsed to just 7.8%, setting implied volatility at a massive 18.61% premium. On top of the underlying threat of the covid impact on the economy, this is driven by fear of overvaluation of US tech giant stocks that continue to surge and it is not a reflection of the broader equity market including small caps and non US stocks. In contrast, the VSTOXX is unchanged from 26.66% to 26.72% while realised volatility on the Eurostoxx50 remains at 18%. In precious metals, implied volatility increased further, in tandem with a bumpy consolidation of underlying prices. Implied volatility for gold is up form 21% to 23% while for silver it is up from 44% to 54%. Crude implied volatility continued its landing, down from 35% to 25%, while the underlying prices have barely moved for the past 2 months. The implied volatility in the agricultural sector stopped its downward course in tandem with a recovery in underlying prices (to roughly 6-month high).
1 Read the latest reports to our proprietary index on China’s economic activity: Commodity Leading Index Economic Activity China (August 2020)
Source: Four Elements Capital

