Alphien is proud to have hosted a research project by students from École Polytechnique, in partnership with Lyxor and Alphien. Emile Balembois, Sylvain Cazaux, Agathe de La Selle, Tom Thimonier and Ming Yang explored the relationship between companies’ environmental responsibility score and financial performance using environment pillar score from a leading indices provider. This project was supervised by Patricia Crifo and Ban Zheng from the Department of Economics at École Polytechnique.
Alphien provided its secured, cloud-based quantitative research platform, including database and Qlib research library to support the project.
In this research paper, they studied the relationship between specific companies’ environmental responsibility score and financial performance. Environment pillar scores on companies located in the USA and Europe were used.
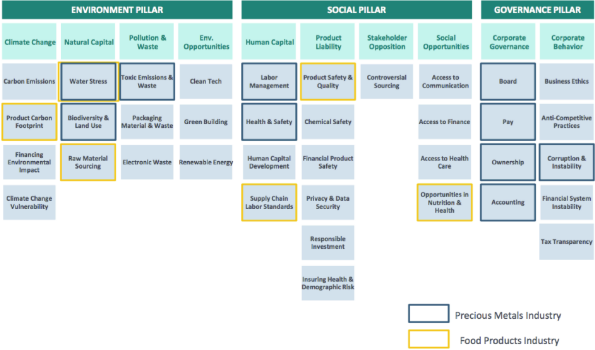
Image: ESG score factors
Contents
- 1 Part 1: Influence of sector on environmental score/financial performance relationship
- 2 Part 2: Influence of Paris agreement (COP21) on relationship between environmental score and financial performance in Europe
Part 1: Influence of sector on environmental score/financial performance relationship
The study found that, in the USA, the relationship between environmental score and financial performance varies significantly across sectors.
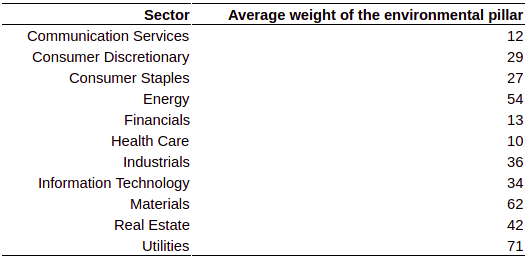
Table: Average weight of the environmental pillar in each sector
As seen in the table above, average environmental score contribution to overall ESG rating varies greatly across sectors. The study splits sectors between high and low overall environmental score contribution as a percentage of total score. After splitting the data, the relationship between environmental score, financial performance and a number of other relevant factors was tested using a regression model.
As shown in regression results below, the study found that:
- There is a much lower probability that environmental score is not statistically significant when the model is applied to sectors with high exposure to environmental score (as measured by P-values).
- The regression model using environmental score is better at explaining financial performance variance in sectors with high exposure to environmental score (as measured by adjusted R score).
Low contribution from environmental score sample
The sectors with low contribution from environmental score are Health Care, Financials, Consumer Staples, Consumer Discretionary and communication services.
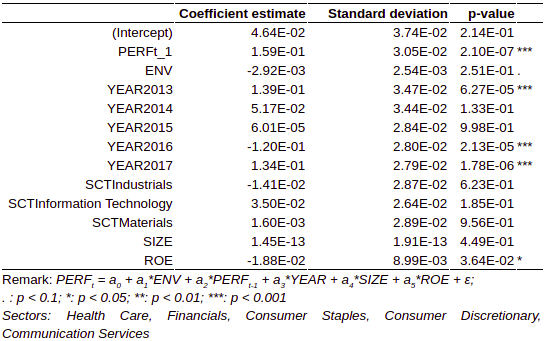
Table: Regression in the United States on the sectors least influenced by the environmental rating, adjusted R2 = 0.174
In the low environmental score contribution sample, results are as follows:
- A low adjusted R squared of 0.17 which indicates the model does not explain well variations in financial performance.
- A high environmental score P value of 0.25 which indicates a high probability that environmental score is not statistically significant in this model.
High contribution from environmental score sample
The sectors with high contribution from environmental scores are: Energy, Materials, Industrials, Information Technology, Materials, Real Estate and Utilities.
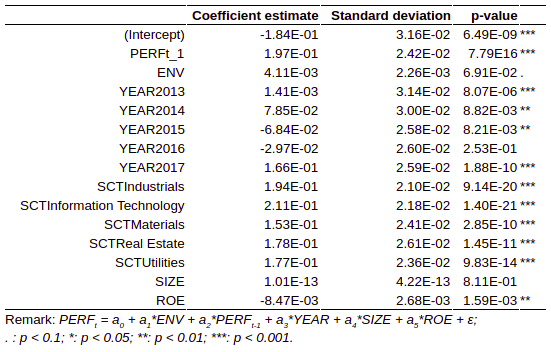
Table: Regression in the United States on the sectors most influenced by the environmental rating, adjusted R2 = 0.24
On the high environmental score contribution sample, results are as following:
- A higher adjusted R-squared of 0.24 (compared to 0.17 before) which indicates a higher share of the financial performance is explained by the model.
- A lower environmental score p-value of 0.07 (compared to 0.25 before) which indicates a much lower probability that environmental score is not statistically significant in the model.
Part 2: Influence of Paris agreement (COP21) on relationship between environmental score and financial performance in Europe
The research also tested the influence of the Paris agreement (COP 21) on the relationship between environmental score and performance for European companies. COP 21 is an agreement among the leaders of more than 170 countries to reduce greenhouse gas emissions and limit the global temperature increase. While a causal relationship cannot be concluded from this study, there is a clear statistical difference between before and after COP 21 when it comes to the relationship between financial performance and environmental score in Europe.
Methodology
The study splits data into two sets: 2012-2015 and 2016-2017 (the COP 21 conference happened from November to December 2015). It then applies a regression model to financial performance using environmental score and previous year performance as independent variables.
Results
Table: Pre COP 21 sample (2012-2015)
Table: Post COP 21 sample (2016-2017)
The regression results show a much lower p-value for environmental score, indicating a much lower probability of environmental score being non-statistically significant post COP 21 conference.
We are dedicated to support academia by providing free access to our research platform. Learn more about what our platform offers.


